Driving Democracy Forward
In the complex machinery of American democracy, three critical components must work in perfect sync to ensure every voice is heard: an accurate Census, fair Redistricting, and active Voting. At Studio Red, we recently had the privilege of partnering with several powerhouse organizations to help make their ideas into a successful visual.
Fair Representation in Redistricting (FRR)
Redistricting determines the "allocation of power." FRR is a national funder collaborative dedicated to ensuring that the map-drawing process is transparent, inclusive, and fair. By supporting communities of color and underrepresented groups, they fight against gerrymandering to ensure that district lines reflect the true heart of our neighborhoods rather than political interests.
Census Funders Collaborative (CFC)
Everything begins with the count. Census Funders aligns funding and philanthropic strategies to promote a fair and accurate census. Because census data dictates how billions in federal funding are distributed and provides the foundation for redistricting, CFC works tirelessly to reach "hard-to-count" populations—ensuring that no community is left invisible.
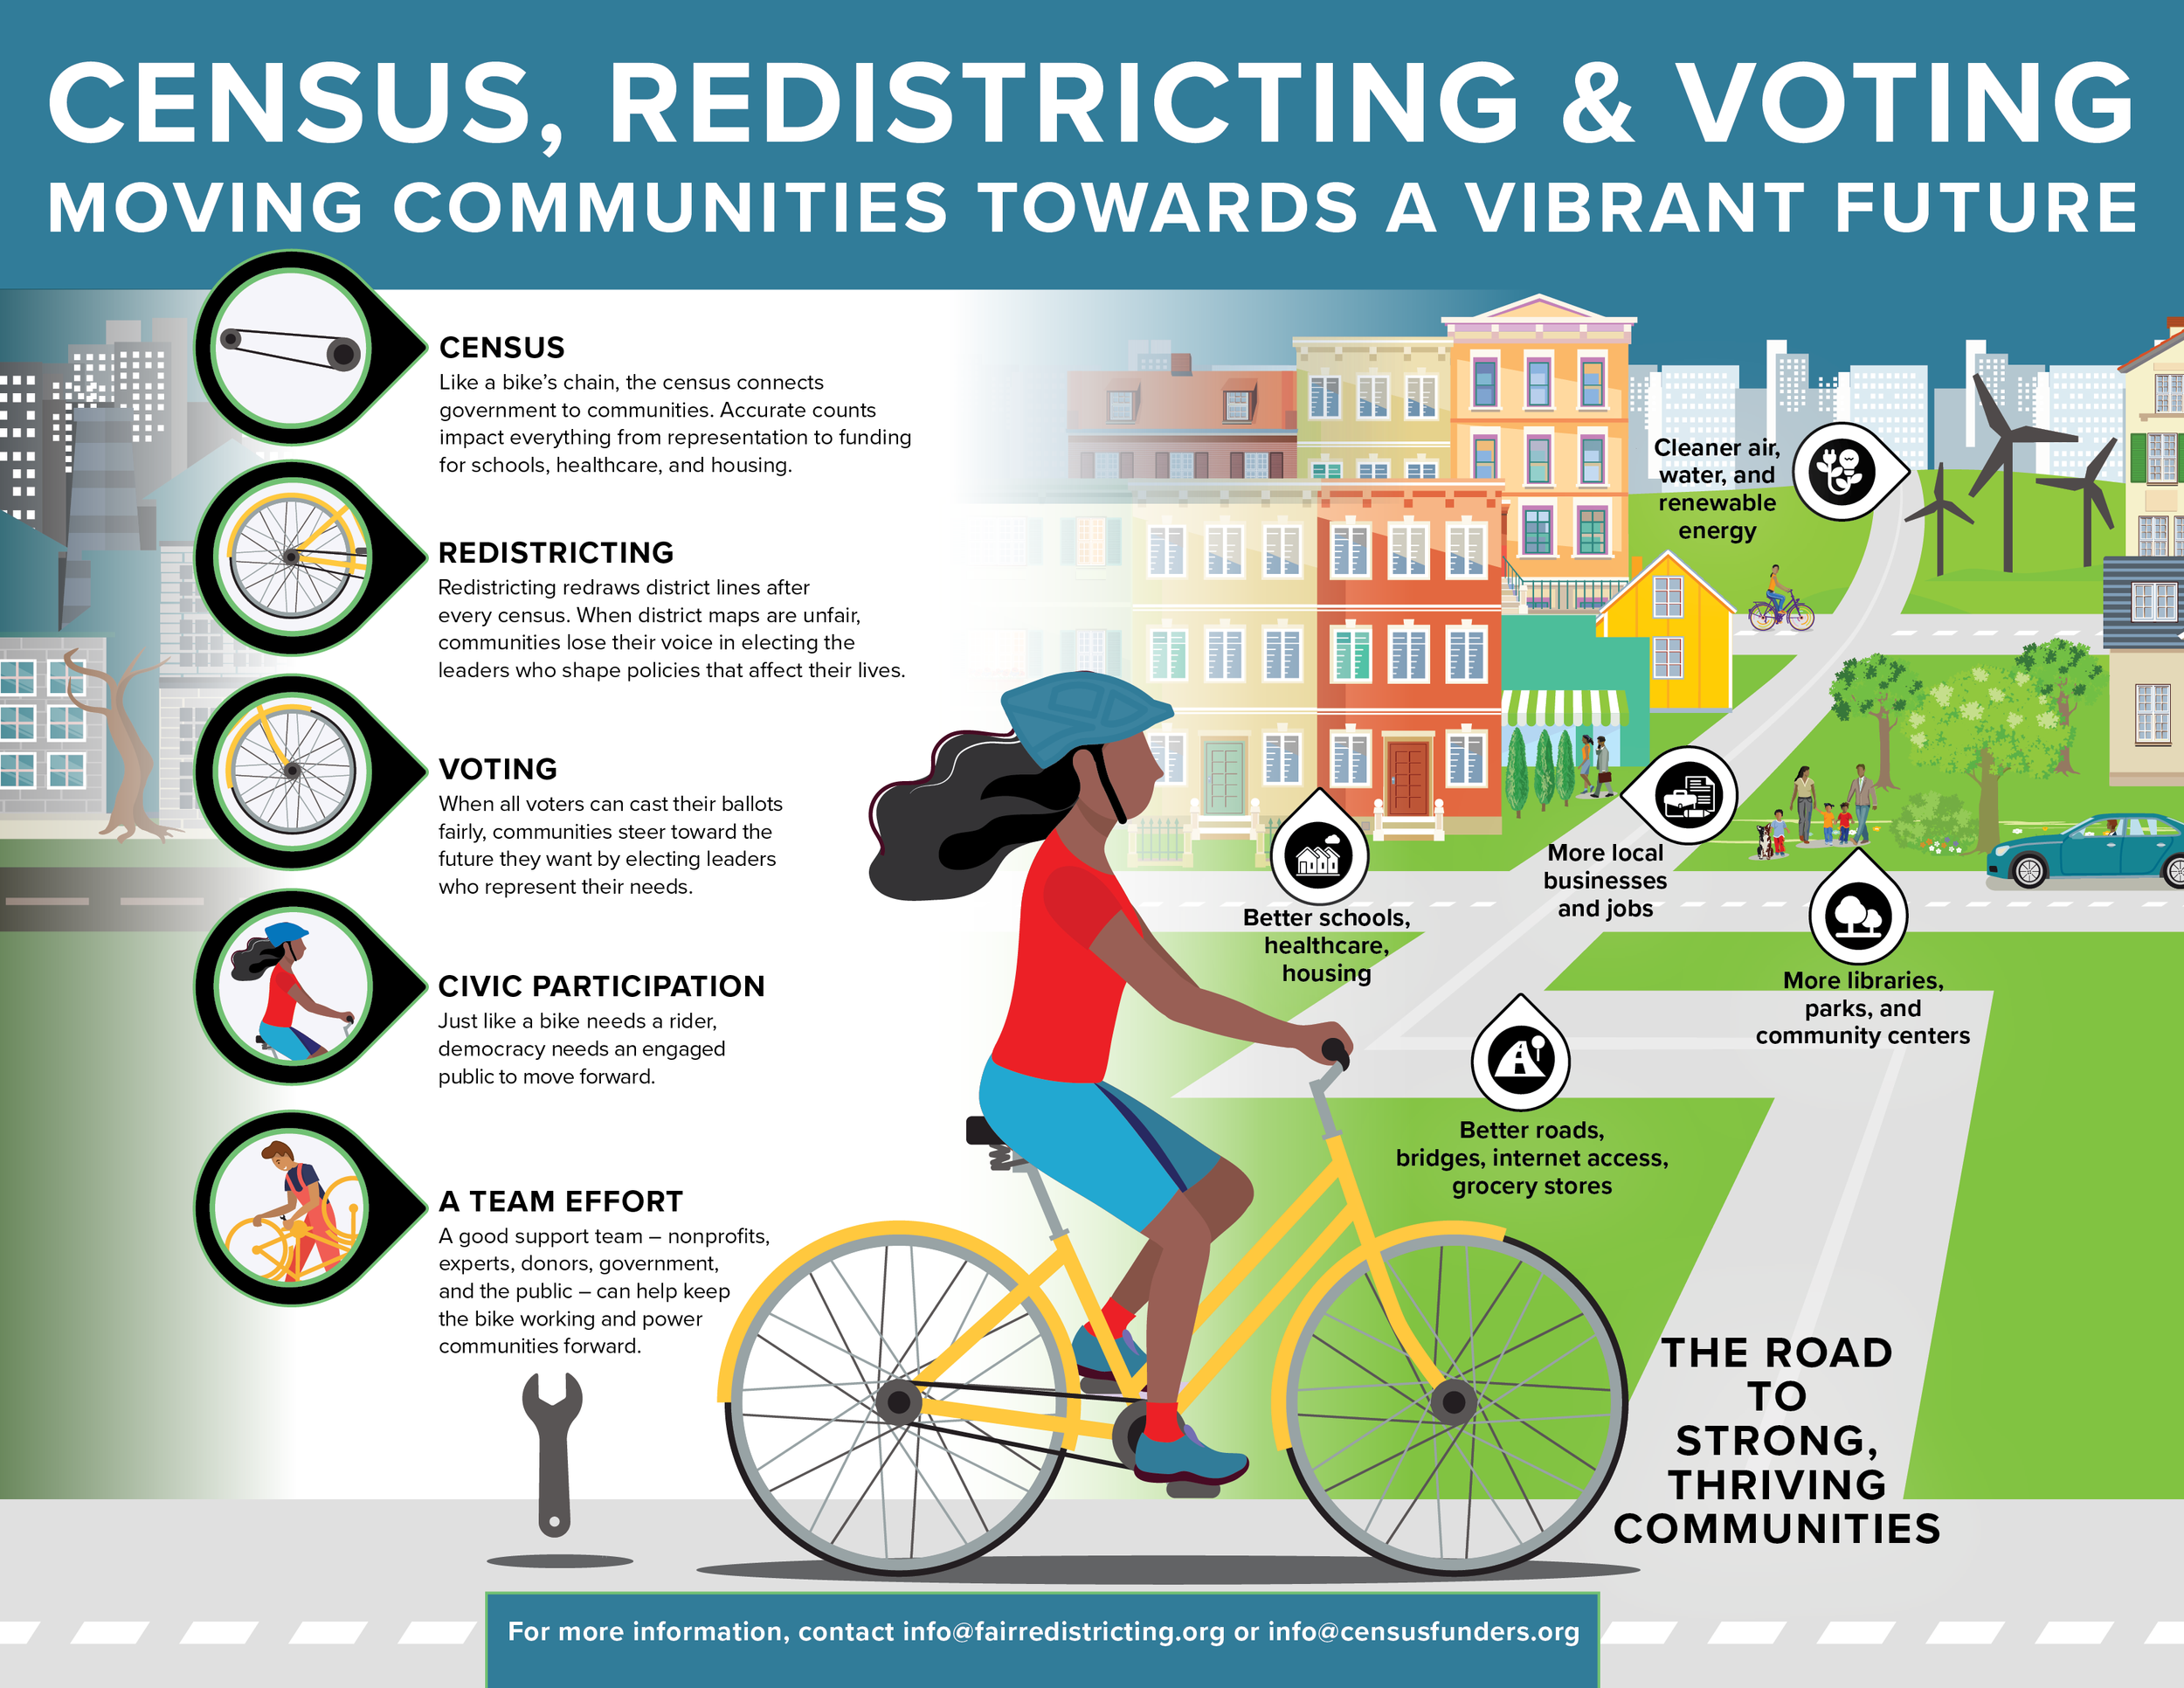
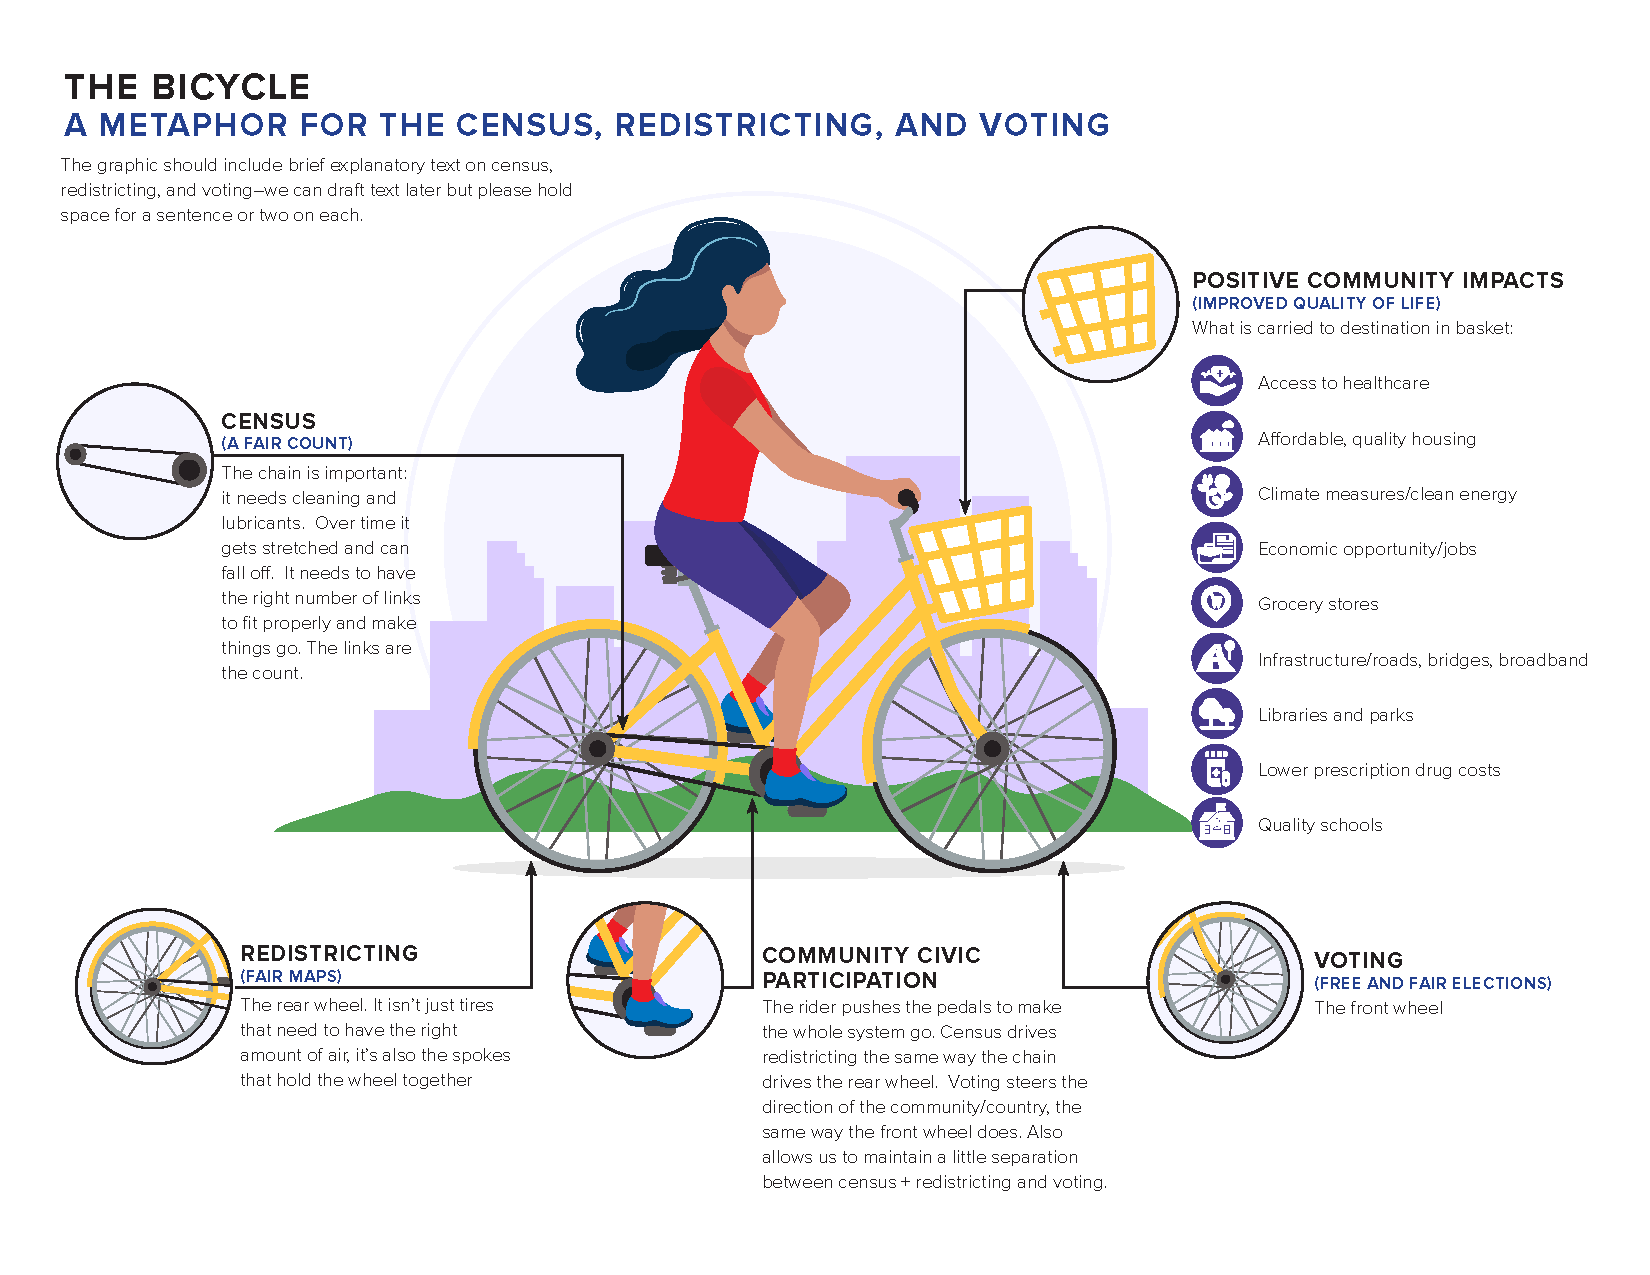
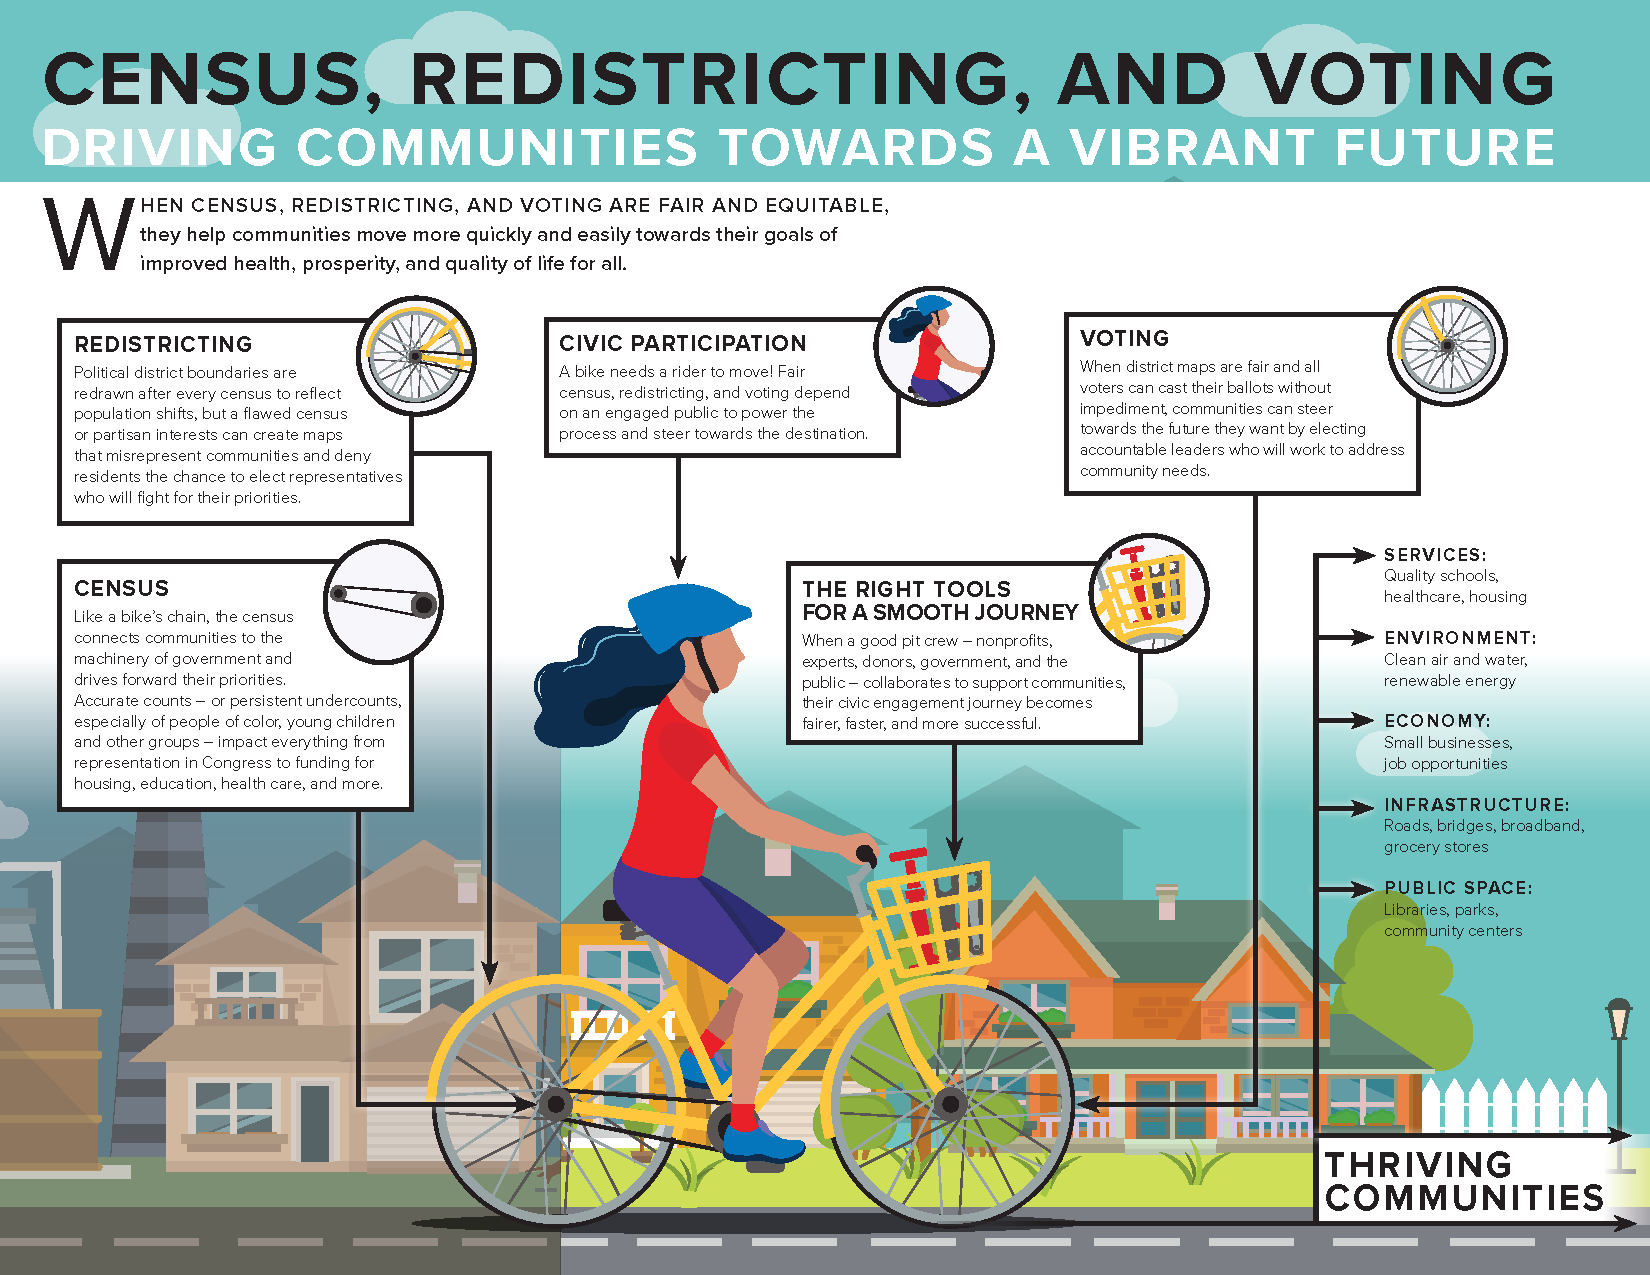
This team came to us to help them create a visual metaphor that reflected all the parts in census, redistricting and voting. Over a long phone meeting, we explored different road: assembly lines, mechanical pocket watches, and bicycles as possible visuals. We landed on using a bicycle with all of its moving parts and as a vehicle to move communities forward.
“This infographic has become one of our most evergreen materials, and has been especially helpful in ‘making the case’ for those who are new to this work. Thanks to Alston and team for being great creative partners and helping us make a complex subject so accessible. We're grateful to you for being such positive, responsive collaborators on this project (and others)!”
—Elly P., Fair Representation in Redistricting
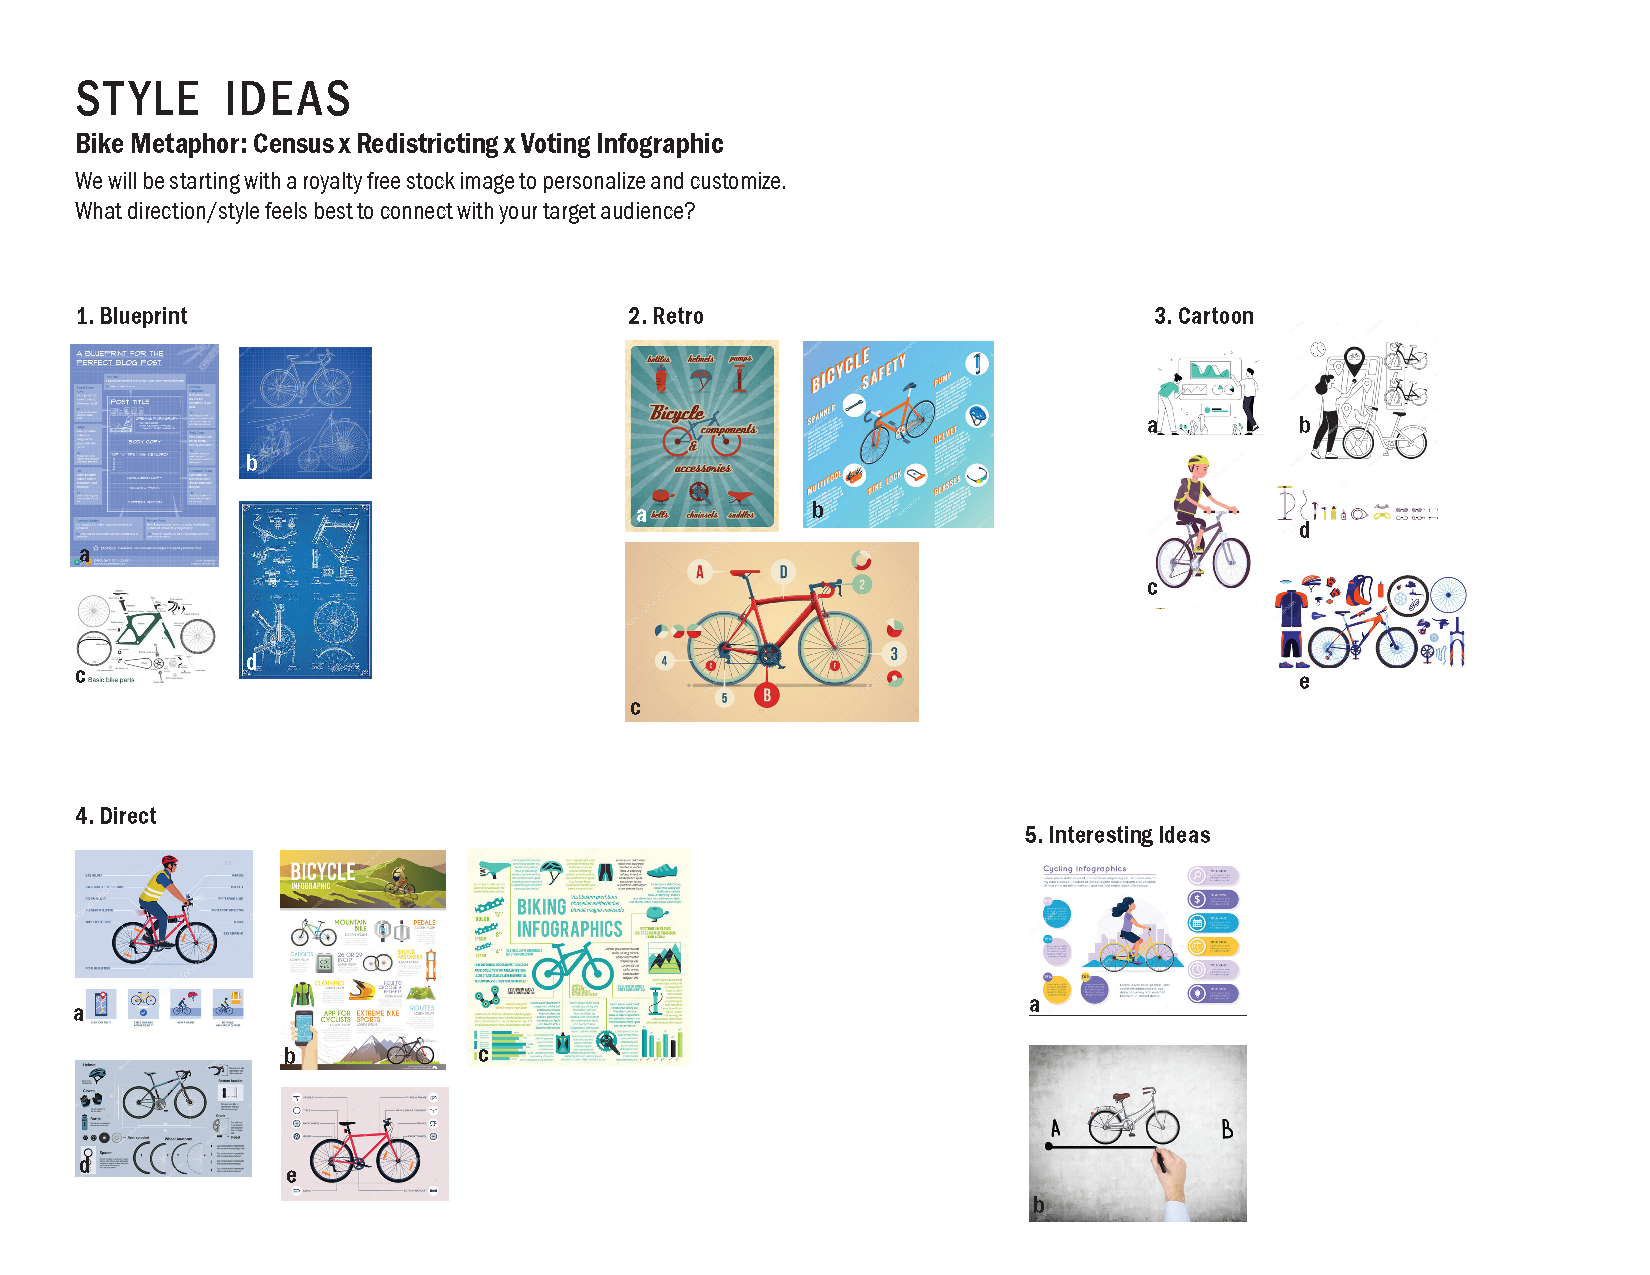
Initial design directions presented to client to help establish overall look and feel of the final infographic.
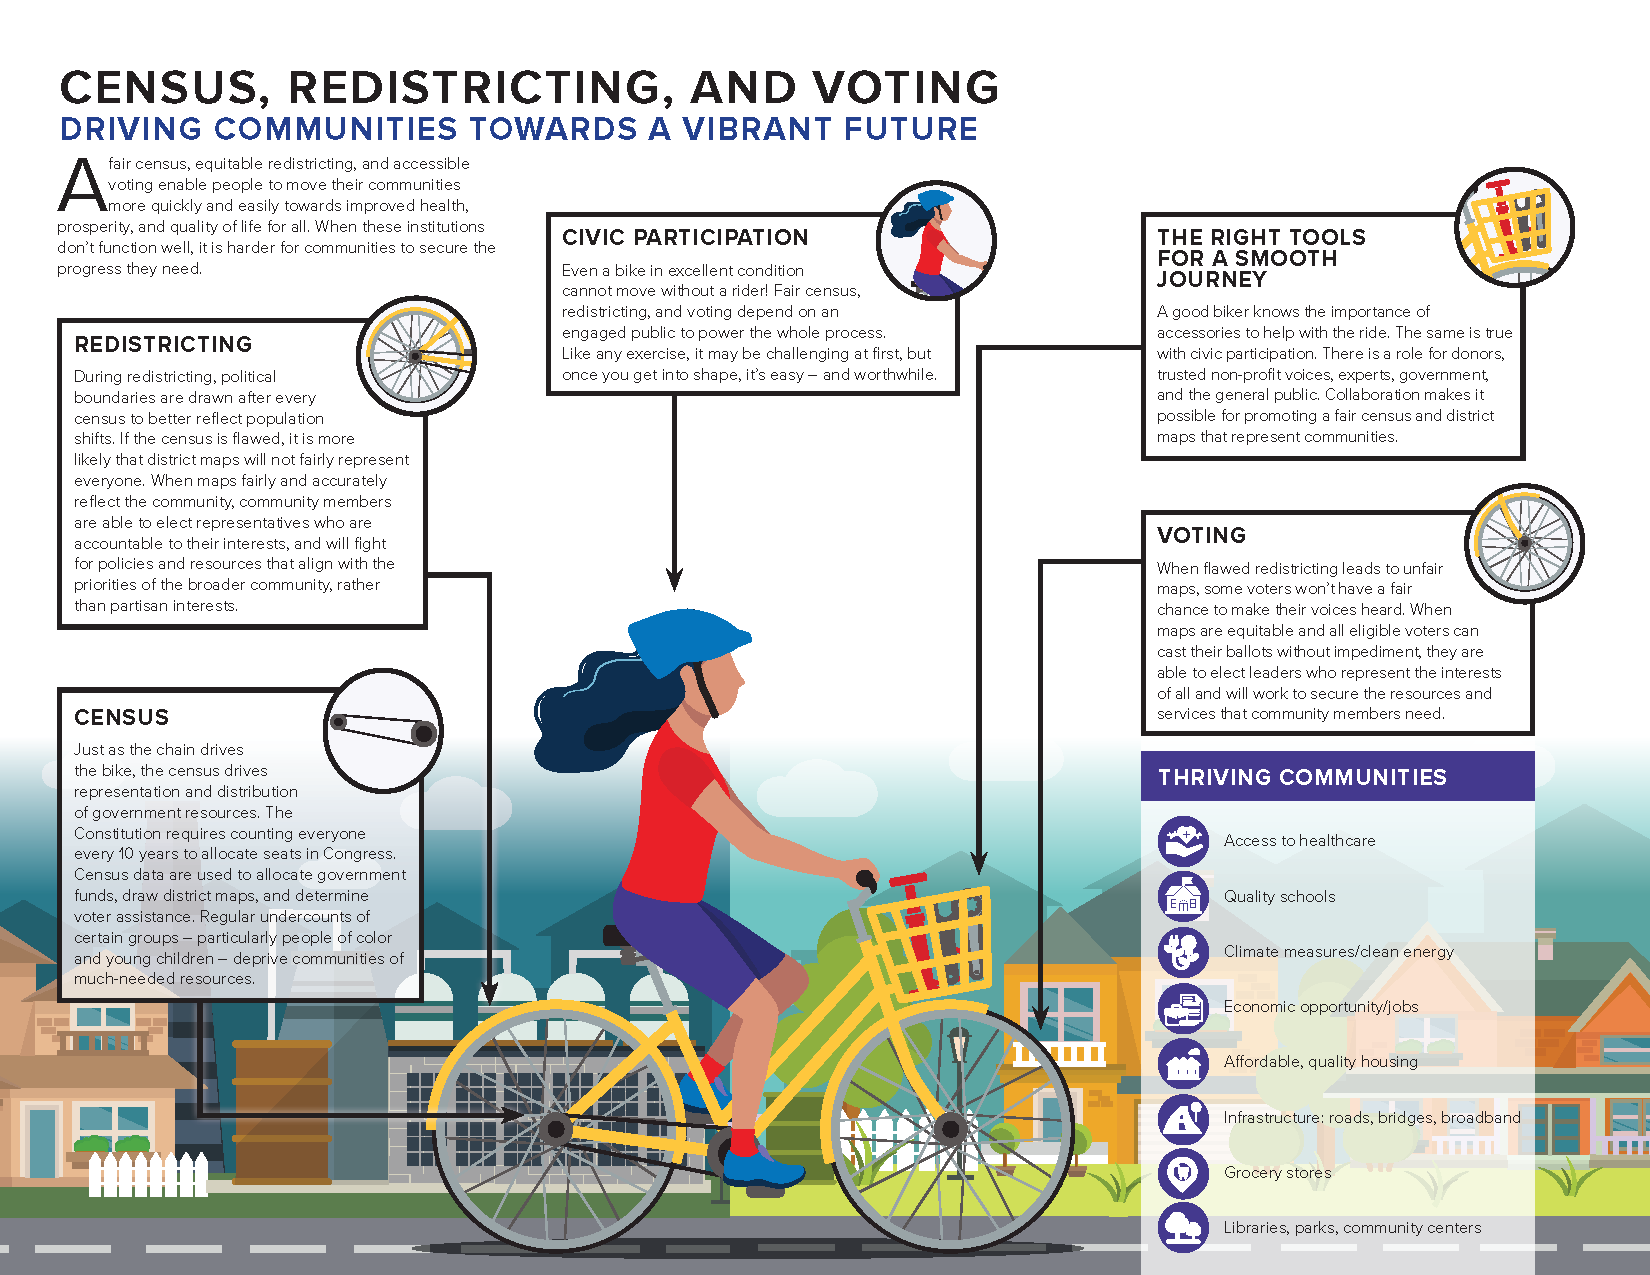
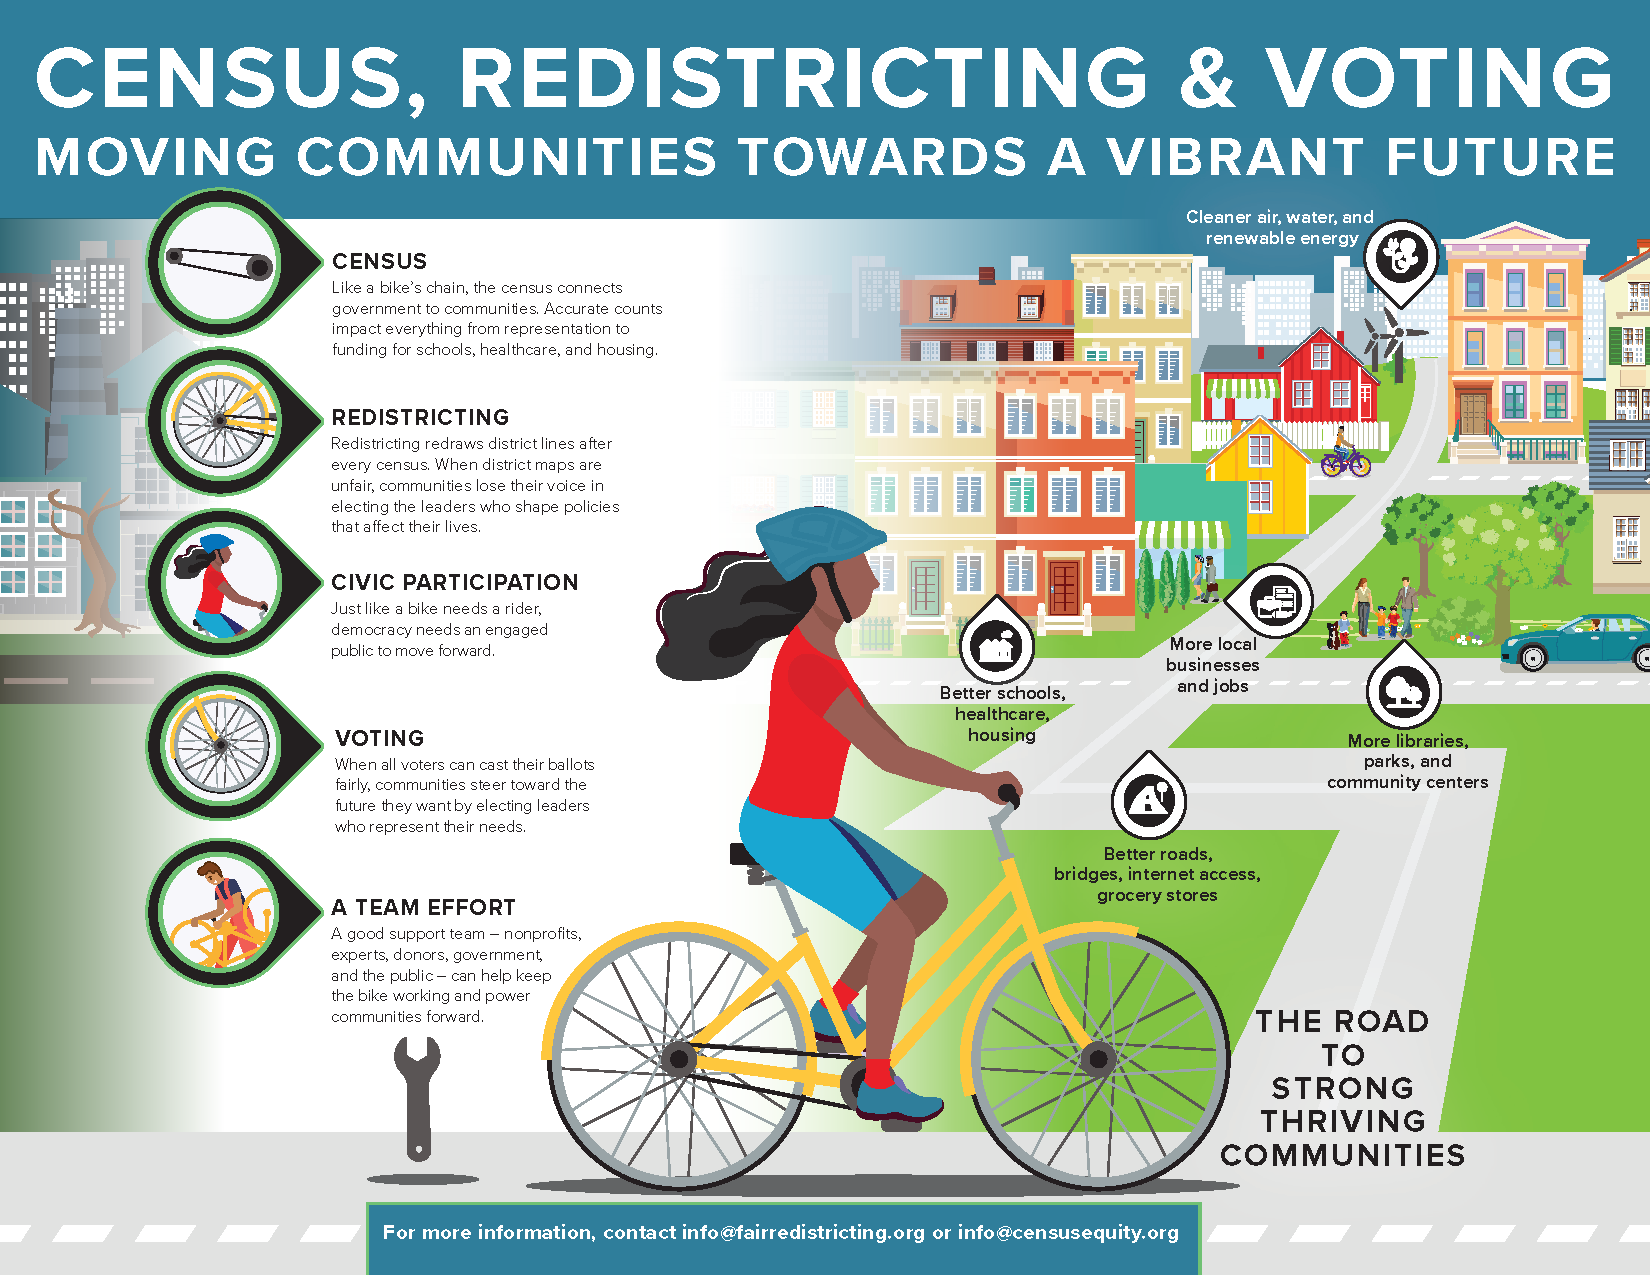
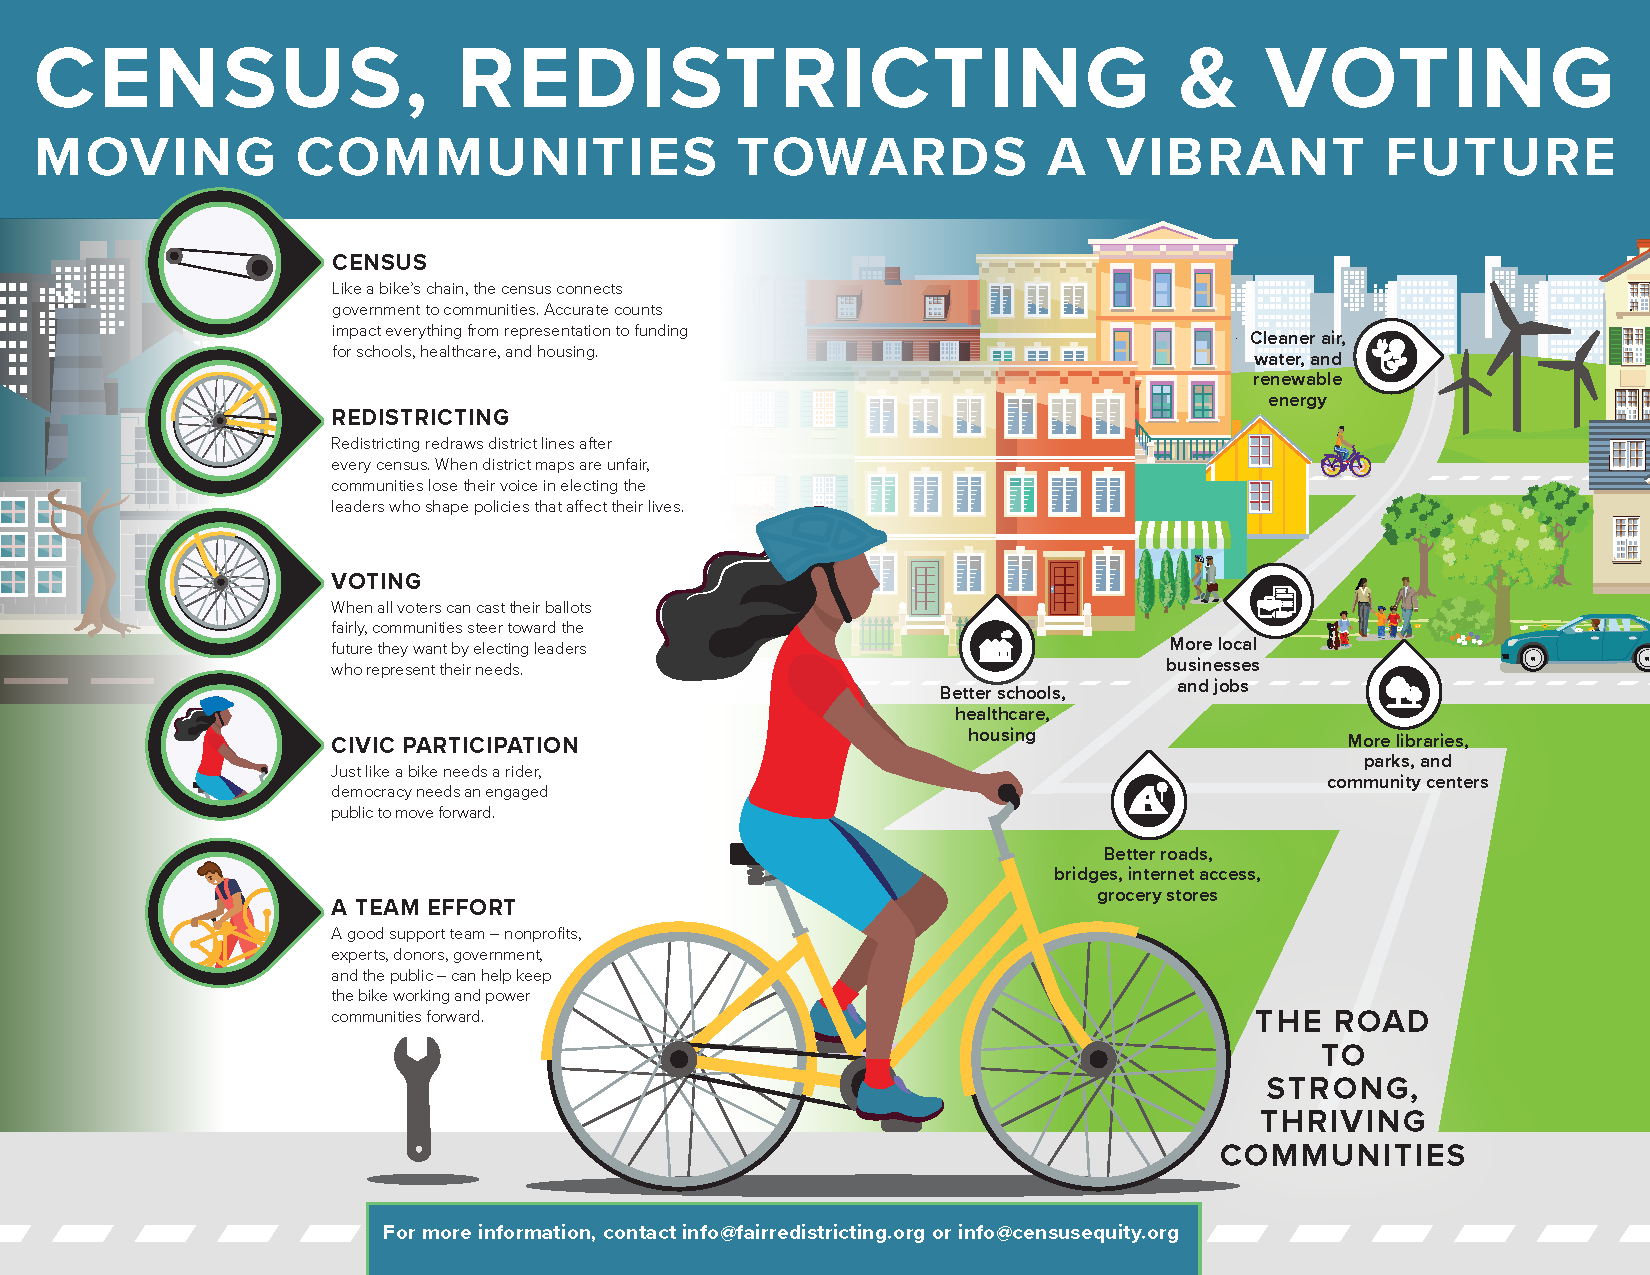

The final version of the published infographic.